IsItMosquitoSeasonYet
← National tracker
Indiana · Mosquito Season Guide

Is it mosquito season in Indiana?


Right now Live
···

II  ·  Season Timing
Typical season — Indianapolis
Historical mosquito activity index by month
Minimal Low Moderate High Peak Index 0–5
Choose a city
60+
mosquito species recorded in Indiana
May–Sept
typical active season statewide
July–Aug
peak pressure months
WNV + EEE
disease risks — monitored by ISDH
IV  ·  Key Species
Culex pipiens northern house mosquito
Culex pipiens
⚠ WNV Vector — Primary Risk

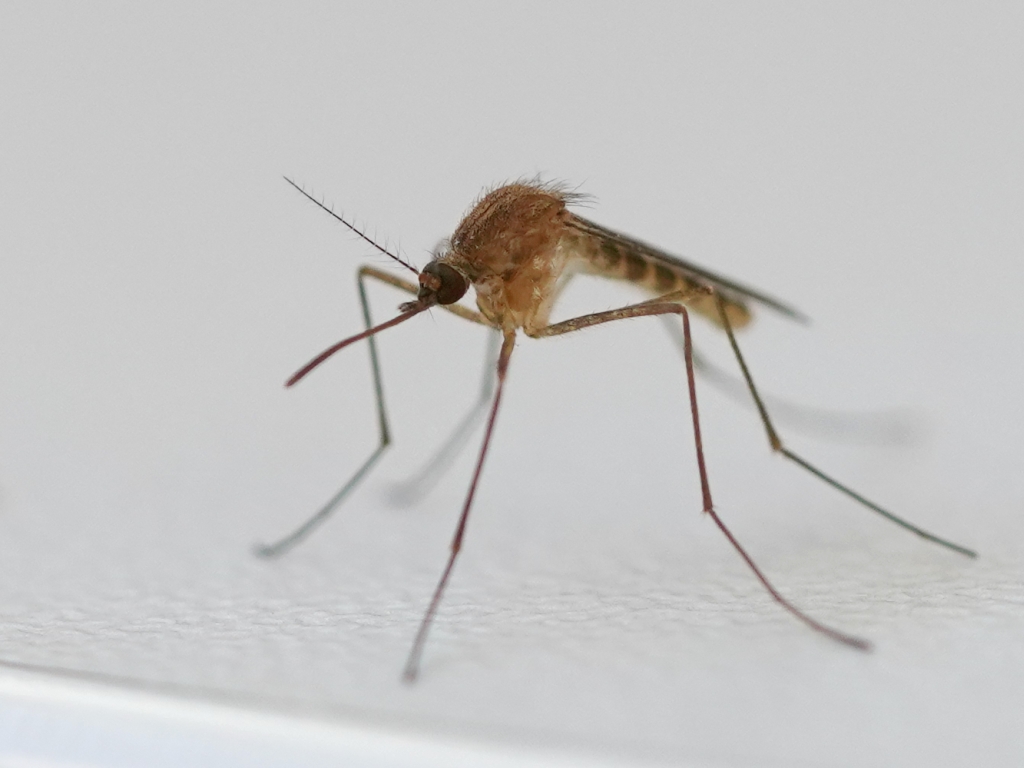
Northern house mosquito — the dominant West Nile virus vector in Indiana. Breeds in stagnant, organic-rich water: storm drains, catch basins, neglected containers. Bites at dusk and through the night. Marion County (Indianapolis) and surrounding counties record the highest WNV activity statewide.

Aedes vexans inland floodwater mosquito
Aedes vexans
Inland Floodwater Mosquito

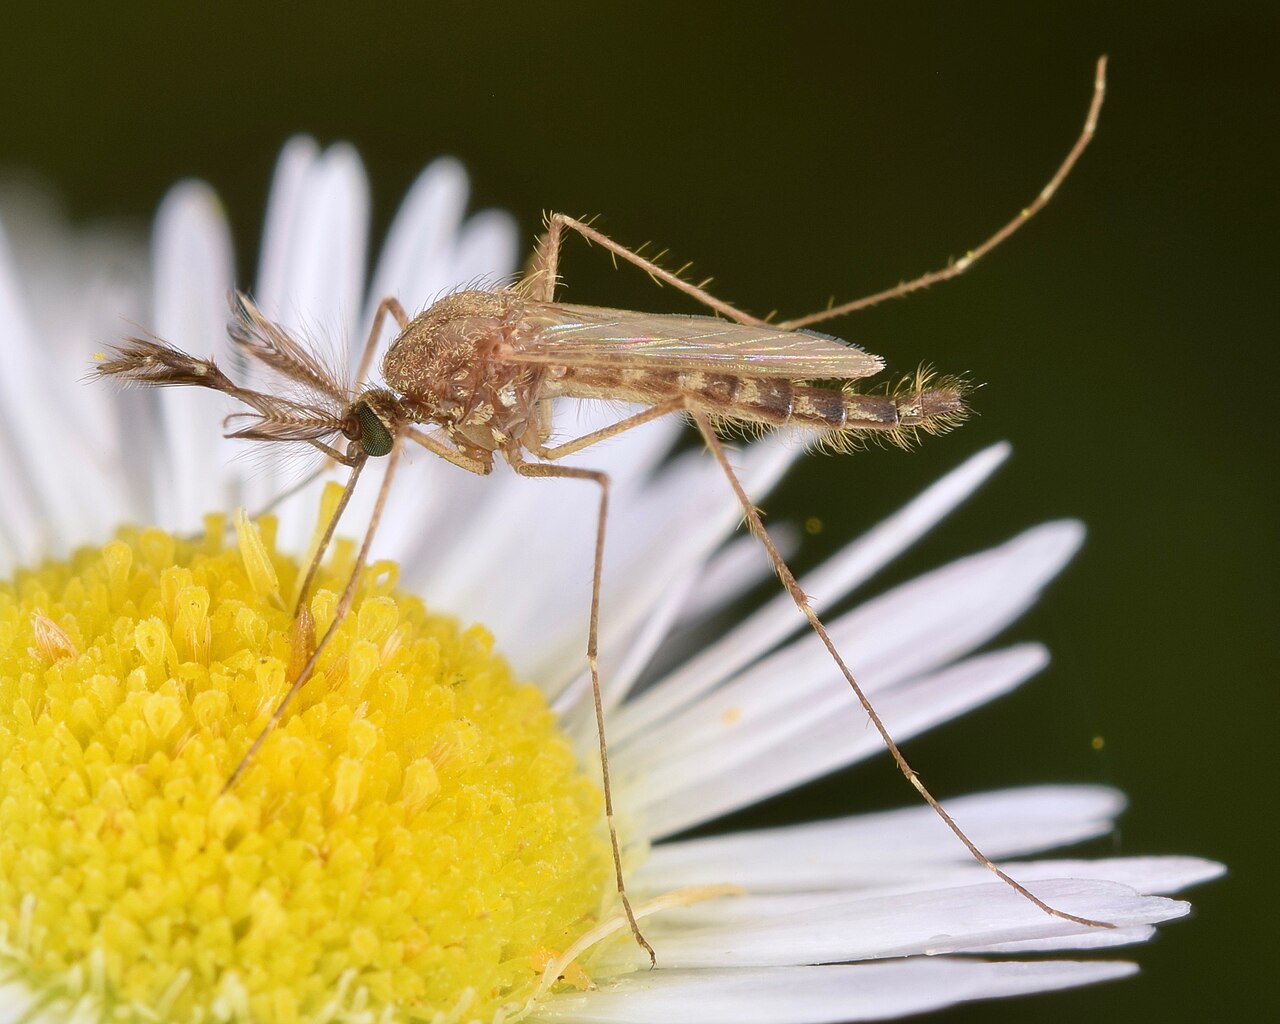
Indiana's Wabash River floodplain and the lowlands along the White River make this species explosively abundant after heavy rains. Eggs can lie dormant for years in dry soil and hatch en masse within days of flooding. Populations can surge from near-zero to overwhelming in under a week following significant rainfall.

Aedes albopictus Asian tiger mosquito
Aedes albopictus
Asian Tiger Mosquito

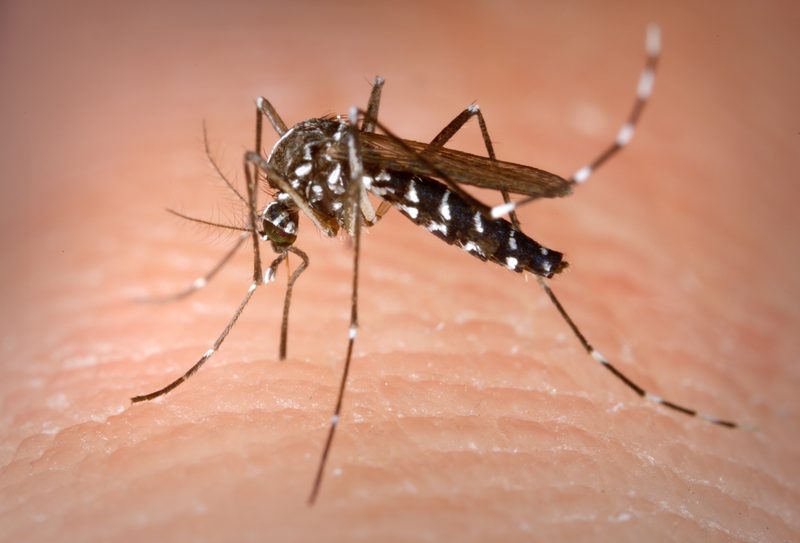
The Asian tiger mosquito has established itself across central and southern Indiana, with active expansion northward. Unlike Cx. pipiens, it bites aggressively during daylight hours — particularly in shaded suburban yards. Breeds in any small standing water: bird baths, clogged gutters, pot saucers. Most prevalent May through October.

V  ·  Indiana Mosquito Context

Great Lakes wetlands and the EEE belt

Indiana's northern tier sits within the Great Lakes EEE (Eastern Equine Encephalitis) belt — the same zone that produced Michigan's deadly 2019 outbreak. Lake Michigan's wetlands, the Indiana Dunes National Park marshes, and the extensive boggy terrain in St. Joseph, LaPorte, and Marshall counties create prime habitat for Coquillettidia perturbans, the cattail marsh mosquito that serves as EEE's primary bridge vector to humans. ISDH issues EEE surveillance alerts for this region most summers.

The Wabash River floodplain

The Wabash River drains more than a quarter of Indiana's total land area, and its floodplain is among the most productive floodwater mosquito habitats in the Midwest. Ae. vexans eggs can accumulate in floodplain soil for years; a single significant rain event following a dry period can trigger simultaneous hatching of multiple year-classes. Terre Haute and the Wabash corridor routinely experience the most intense floodwater surges in the state. These populations disperse up to five miles from the hatch site — outdoor events near river lowlands can be severely affected within days of a storm.

West Nile surveillance in Indiana

The Indiana State Department of Health (ISDH) operates a statewide West Nile virus surveillance program running from May through October, testing mosquito pools and tracking avian mortality. Marion County (Indianapolis), Hamilton County, and Allen County (Fort Wayne) historically account for the majority of confirmed human WNV cases. Indiana typically records between 5 and 30 human WNV cases per year, with severe neuroinvasive disease cases concentrated in older adults. Check current ISDH WNV reports →

VI  ·  City-by-City Breakdown
City Season Off-season Notes Live data
Indianapolis May – Sep Off Oct–Apr Marion County core; Cx. pipiens dominant with WNV detections most summers in ISDH surveillance traps; urban heat island extends season at both ends; Ae. albopictus expanding rapidly through suburban neighborhoods; Eagle Creek Reservoir and White River corridor amplify early-season populations Check live
Fort Wayne May – Sep Off Oct–Apr Three-river confluence (St. Marys, St. Joseph, Maumee) creates one of the most intense floodwater mosquito situations in northeast Indiana; historically significant Ae. vexans pressure after spring and summer thunderstorms; WNV detected in Allen County trap pools regularly; Ae. albopictus now established in residential areas Check live
Evansville Apr – Oct Off Nov–Mar Along the Ohio River — extended season compared to central Indiana (2–3 weeks earlier start, later finish); Ae. albopictus well established and active through October; Pigeon Creek watershed; WNV detected in Vanderburgh County; river bottom flooding drives significant Ae. vexans population surges Check live
South Bend May – Sep Off Oct–Apr Adjacent to Lake Michigan wetland corridor — St. Joseph and LaPorte counties are within the northern Indiana EEE surveillance zone; Potato Creek State Park and Yellow River wetlands nearby; Coquillettidia perturbans (EEE bridge vector) present in cattail marsh habitat; ISDH monitors this region closely each season Check live
Terre Haute May – Sep Off Oct–Apr Wabash River floodplain — among the most intense Ae. vexans locations in the state; significant post-storm population explosions common; Vigo County floodplain terrain means large-scale hatching events are regular occurrences; Ae. albopictus present in residential areas; WNV detected locally Check live
Bloomington May – Sep Off Oct–Apr Monroe Reservoir watershed; Ae. albopictus and Cx. pipiens both present; Indiana University campus grounds have significant container breeding in wooded areas; slightly shorter season than southern Indiana due to elevation; WNV detected in Monroe County; lower peak than urban centers Check live
Muncie May – Sep Off Oct–Apr Delaware County; flat agricultural landscape with extensive wetland drainage; White River corridor; Cx. pipiens and Ae. vexans both common; standing water in low-lying farm fields after heavy rains amplifies populations; Ae. albopictus present in residential areas; WNV detected in surrounding counties Check live
More State Guides
Florida Year-round activity in the south — 80+ species including invasive Ae. aegypti and the Asian tiger mosquito across all 67 counties Texas ~85 species across four climate zones — Gulf Coast active March through November, with year-round pressure in the Rio Grande Valley California Central Valley is the #1 West Nile corridor in the US — invasive Ae. aegypti and Ae. albopictus now established in 20+ counties Georgia Atlanta metro leads the Southeast in Asian tiger mosquito density — active statewide March through November New York Ground zero for West Nile in the US (1999 Queens outbreak) — NYC metro and Long Island see the highest Northeast seasonal pressure Illinois Home of the 2002 Cook County West Nile outbreak — the deadliest urban WNV event in US history — peak season June through September Ohio Lake Erie to the Ohio River — WNV active in Franklin and Cuyahoga counties, with floodwater species surging after summer storms Pennsylvania Philadelphia WNV corridor meets rural EEE risk in western PA — the densest human population in the mid-Atlantic mosquito belt Michigan Site of the 2019 EEE outbreak — the deadliest in decades — 10 human cases and 6 deaths concentrated in SW Michigan Great Lakes wetlands New Jersey Oldest organized county mosquito control in the US (1914) — Pine Barrens EEE corridor and fierce salt marsh Shore species Virginia Tidewater season runs April–October — the longest mid-Atlantic window — with the Great Dismal Swamp as an active EEE hotspot North Carolina The coastal plain runs one of the longest seasons in the Southeast — NC leads the nation in La Crosse encephalitis cases from the Appalachian foothills Maryland Chesapeake Bay watershed creates extraordinary mosquito habitat — tidal marshes, Eastern Shore wetlands, and the DC-Baltimore corridor combine for dense seasonal pressure Tennessee Memphis and the Mississippi River corridor historically record the highest WNV case counts in the mid-South — Ae. albopictus has colonized all 95 counties Louisiana The Gulf Coast's most intense pressure — coastal marshes and summer rains keep Cx. quinquefasciatus and Ae. aegypti active from March through November Alabama Mobile Bay to the Tennessee Valley — Ae. albopictus has reached all 67 counties and peak WNV season runs June through September South Carolina Low Country marshes produce some of the Southeast's densest Anopheles and Culex populations — season runs March through November Minnesota 10,000 lakes means 10,000 breeding sites — the Northwoods sees intense but short July–August peaks, while the Twin Cities face a longer June–September window Wisconsin Great Lakes wetlands and the Mississippi River backwaters drive strong WNV pressure in the Milwaukee corridor — peak season July through August Missouri At the confluence of the Missouri and Mississippi rivers — St. Louis historically ranks among the highest WNV cities in the US — season May through October Arkansas Delta rice-field flooding and the Arkansas River bottomlands create some of the highest rural mosquito pressure in the mid-South — active April through October Washington Western WA stays mild and damp year-round; the Yakima Valley and Columbia Basin face the highest WNV risk in the Pacific Northwest — peak July through September Arizona Monsoon season (July–September) drives sudden mosquito explosions across the Valley of the Sun — WNV detected annually Colorado Front Range WNV corridor stretches Denver to Fort Collins — eastern plains carry the state's highest risk Connecticut Connecticut River valley WNV pressure meets EEE risk in inland freshwater wetlands — active May through October Delaware Chesapeake and Delaware Bay marshes create outsized pressure for the nation's second-smallest state Hawaii Year-round activity at sea level — no native species, but Ae. aegypti and tiger mosquitoes established statewide Idaho Snake River Plain irrigation districts fuel summer WNV pressure — season June through September Iowa Mississippi River corridor and prairie wetlands drive intense June–September pressure — WNV active statewide Kansas Great Plains WNV corridor — Wichita and Kansas City see peak pressure July–August; floodwater species surge after storms Kentucky Ohio River corridor and Kentucky Lake wetlands sustain a long April–October season across all 120 counties Maine Short but intense July–August season — EEE detected in some years in the southern coastal plain Massachusetts EEE fatality rate exceeds 30% — the Plymouth County swamp complex is the active epicenter — season May through October Mississippi Gulf Coast near-year-round pressure meets Delta rice-field flooding for one of the South's most intense mosquito environments Montana Yellowstone and Missouri River corridors drive a compressed June–August season — WNV detected most years in eastern MT Nebraska Platte River valley and eastern Nebraska are among the Great Plains' most active WNV zones — peak July–August Nevada Las Vegas monsoon season drives July–September activity; Reno irrigation districts fuel a parallel northern peak New Hampshire EEE detected most years — the southern lakes and coastal plain are in the active Northeast EEE corridor New Mexico Monsoon season (July–September) creates sudden breeding habitat; WNV circulates in the Rio Grande valley annually North Dakota Red River Valley flooding produces some of the Great Plains' most extreme floodwater mosquito events — peak June–August Oklahoma One of the South-Central's most intense seasons — the Arkansas and Red River corridors sustain populations April through October Oregon Eastern Oregon Columbia Basin is the state's WNV hotspot; western Oregon runs a mild coastal season June through September Rhode Island New England's densest coastal pressure — Narragansett Bay salt marshes and WNV active in all five counties South Dakota Missouri River and James River valleys drive summer WNV activity — eastern SD sees the most intense pressure Utah Salt Lake Valley WNV corridor and irrigation districts sustain a July–September peak — drier areas see limited activity Vermont Champlain Valley runs Vermont's longest season — EEE detected in the Lake Champlain lowlands in some years West Virginia Kanawha and Ohio River valleys sustain a May–October season — Ae. albopictus now established statewide Wyoming The shortest meaningful season of any contiguous US state — North Platte valley WNV window is just 6–8 weeks
West Nile, dengue, and EEE: US disease risk by region → Asian tiger mosquitoes: why you're getting bitten during the day → Eliminating standing water: the highest-leverage yard move →